1.4 TiB of cache tables that kept blocking deploys
A staging deploy failed three times in a row. The real culprit was a 1.4 TiB database that was almost entirely Drupal cache.
- #drupal
- #mysql
- #devops
- #cache
I recently had to run a staging deploy that, in theory, should have been routine. It was a large Drupal site, with a pipeline that already worked well. Even so, it failed three times in a row, each time for a different reason.
For anyone outside the field: a deploy is the process of putting a new version of a site on a server, and staging is the test environment where we check everything before it reaches production, the real site people use.
Three errors, one after another #
The first time, the code updated fine, but drush updatedb (the tool that applies pending changes to the database) couldn’t start Drupal. I ran it with extra detail (-vvv) and got this:
[info] key_value table not found. Database may be empty.The staging database had 93 tables, in alphabetical order, and it stopped around cache_dynamic_page_cache. In other words, a copy from production had only made it halfway.
The second time, I asked the pipeline to copy the production database, and the continuous integration (CI) server ran out of memory while downloading the backup. The backup was about 55 GB compressed, far more than I expected.
The third time, I didn’t copy anything. The updates ran fine, but when it reached the cache clear, a new error showed up:
SQLSTATE[70100]: 1317 Query execution was interrupted:
TRUNCATE "cache_dynamic_page_cache"
That’s when I realized the problem wasn’t the pipeline, and I started looking at the database.
The database was almost all cache #
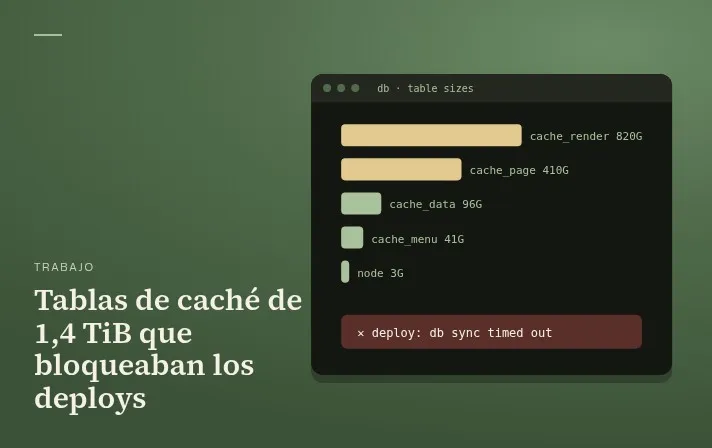
The nightly backup logs showed the size of each table. The production database was 1.4 TiB, and almost all of that space was taken by four tables: cache_page, cache_dynamic_page_cache, cache_render and cache_data. The first two alone were over 1 TiB. It really surprises me that a cache can grow that large without anyone noticing.
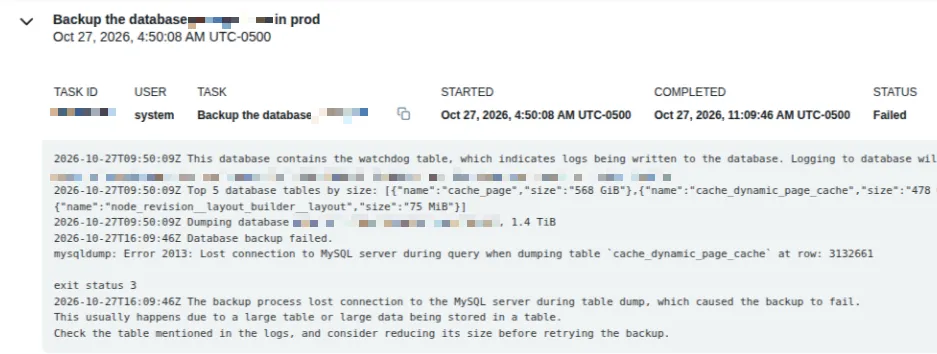
The nightly production backup kept failing on a 1.4 TiB database. Internal details are pixelated.
A cache, in short, is a saved copy of pages or data so they don’t have to be rebuilt every time. It’s useful, but it’s temporary: it can be deleted and rebuilt at any time, and it shouldn’t grow unchecked.
From there, everything started to make sense. The staging copy wasn’t stuck; it just took hours, and the deploy ran updatedb against a half-imported database. The CI server didn’t have room for 55 GB. And the TRUNCATE (the command that empties a table) was waiting on a lock: the nightly backup had a mysqldump reading cache_dynamic_page_cache for more than 4 hours, and TRUNCATE needs exclusive access to the table. So it kept waiting, until I stopped everything that was still running myself.
Why did it keep growing? #
This was the part I enjoyed investigating the most. When the cache lives in the database, Drupal should keep each cache group (what it calls a bin) at around 5,000 rows. Every time cron runs, which is the scheduled maintenance task, system_cron() calls garbageCollection() on every bin and deletes the extra rows.
On production, cron was running normally, but cache_page had over 4 million rows. The database process list looked something like this:
SELECT /*!40001 SQL_NO_CACHE */ * FROM cache_dynamic_page_cache   -- 6 hours
DELETE FROM cache_dynamic_page_cache WHERE created <= ...         -- waiting
INSERT INTO cache_render ...                                      -- queued
The cleanup DELETE was working through hundreds of GB and never finished, because a timeout or the nightly backup cut it off. And the trickiest part: cron catches the error and still records that it finished (system.cron_last), so everything looked fine while the tables kept growing. On top of that, a lot of bot traffic was creating new cache entries faster than cron could clean them up. It was a snowball.
How I fixed it #
On staging, I waited for the copy to finish, until drush status showed Bootstrap Successful. Then I stopped the mysqldump that was holding the lock and emptied all the cache* tables:
SHOW FULL PROCESSLIST;
KILL <dump_id>;
TRUNCATE cache_page;
-- ...and the rest of cache_*
Something odd happened: after the first pass, cache_page and cache_dynamic_page_cache were still full. I think the backup’s transaction hadn’t released them yet, but honestly I’m not sure. I ran it again on those two and it worked. One tip: check with SELECT COUNT(*), not with what information_schema says, because those statistics are cached and kept showing hundreds of GB after the tables were emptied.
With that, the deploy finally went green.
On production I did the same thing, but I coordinated it with the team first. I stopped the nightly backup, which had gotten stuck, and the two cleanup DELETEs, which roll back when stopped, although the TRUNCATE empties the tables anyway. Then I ran drush cr, which with this kind of cache ends up emptying every bin. Shortly after, the four tables had only a few hundred rows, all from new traffic.
There was also a nice extra benefit. We run our preview environments on Tugboat, a tool that creates a copy of the site to review each change. To build that copy, Tugboat downloads the most recent production database backup. With so much cache, the Tugboat account hit its quota: the main preview was frozen in “Building” using 522 GB, and the 55 GB compressed nightly backup was more than Tugboat could handle.
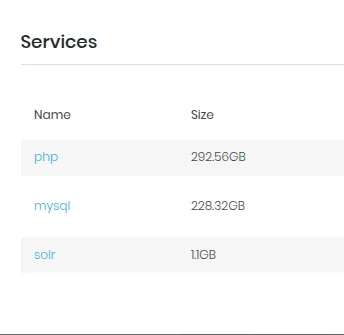
The main preview before the fix.
That’s why clearing the cache wasn’t enough: a new backup was needed too, because Tugboat always uses the latest one. After emptying the tables on production, I took a fresh backup and rebuilt the preview.
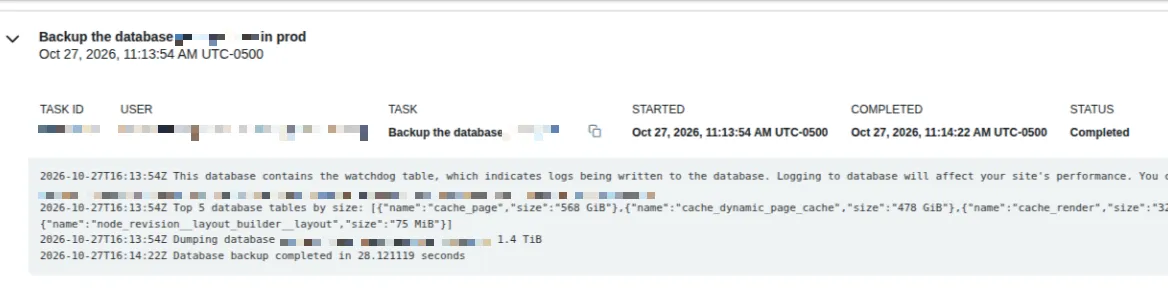
The fresh backup, without the piled-up cache. Internal details are pixelated.
Now the preview uses about 7.2 GB and comes up in about 10 minutes.
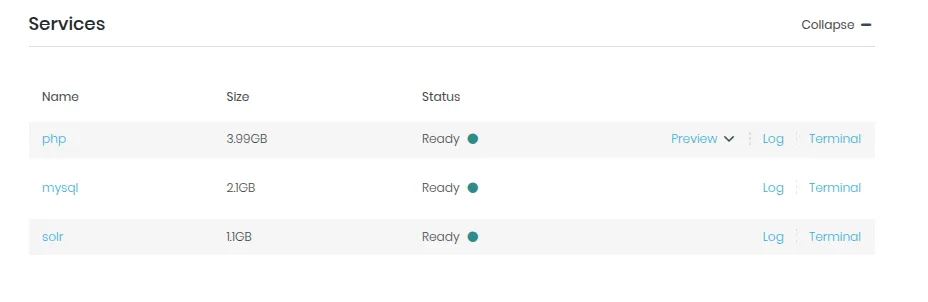
The same preview after the fix.
What I’m taking away #
If a pipeline fails in three different ways, it’s worth looking at the data and not just the pipeline. Cron saying it ran doesn’t mean it finished its job. TRUNCATE and mysqldump don’t get along, so if your deploy clears the cache, it’s better not to do it while the backup is running. And when you import a database, you can leave out the cache rows, for example like this:
gunzip -c db.sql.gz | grep -v '^INSERT INTO `cache_' | drush sql:cliOne more detail: add set -o pipefail to any import that uses pipes. Without it, an import that was cut off halfway can still look successful.
I still need to confirm that the cleanup can now keep the tables around 5,000 rows. If it can’t, the next step will be moving those bins out of MySQL into Memcached and slowing down the bots. In the meantime, it’s worth keeping an eye on the production database so it doesn’t keep growing unchecked. But that will be a topic for another post.